News: Now offering SSO.
Learn more
News: Now offering SSO.
Learn moreAs you know, Badger has the Visualize feature that helps you color code and filter your data to get a more in-depth look at your accounts. This awesome feature comes with a built-in Days Since Last Check-In field that automatically counts the days since you’ve last visited your customer after saving a check-in. Please note that the values in this field are automatic and cannot be edited. Read below to learn how to utilize this great functionality.
Here’s how the Colorize function works for the Days Since Last Check-In field:
1. On the Badger Maps web app, go to Visualize and click Colorize.
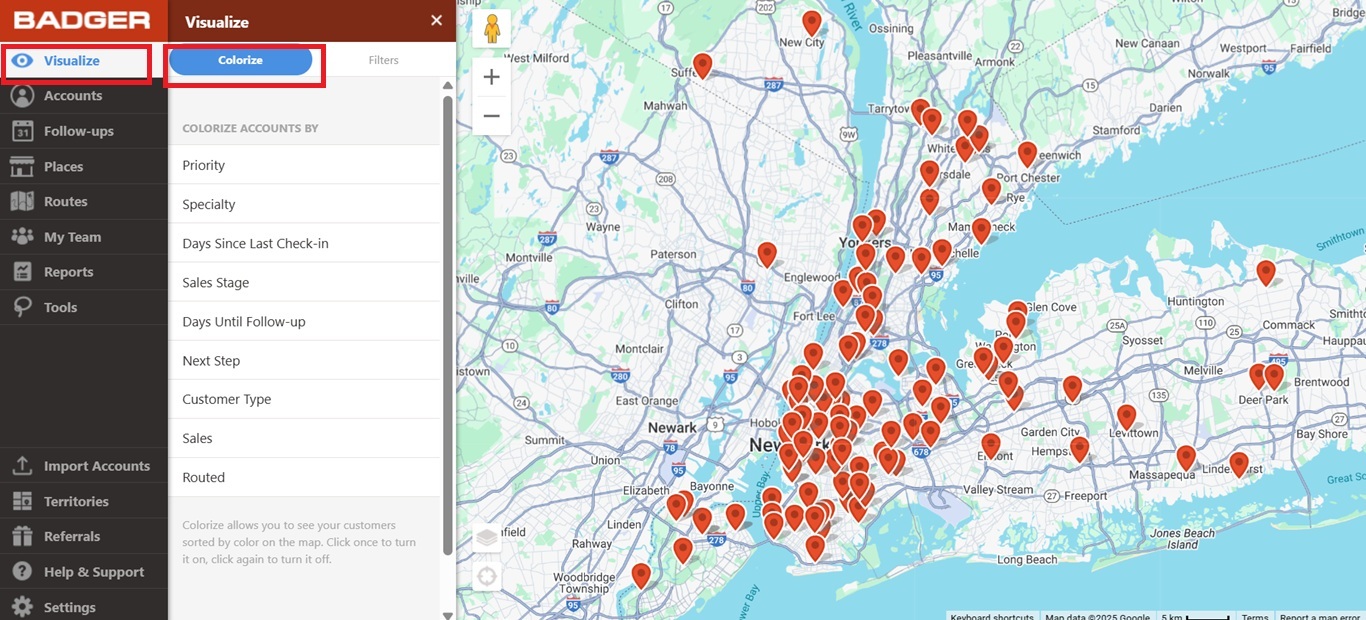
2. Look for Days Since Last Check-In, and click on it.
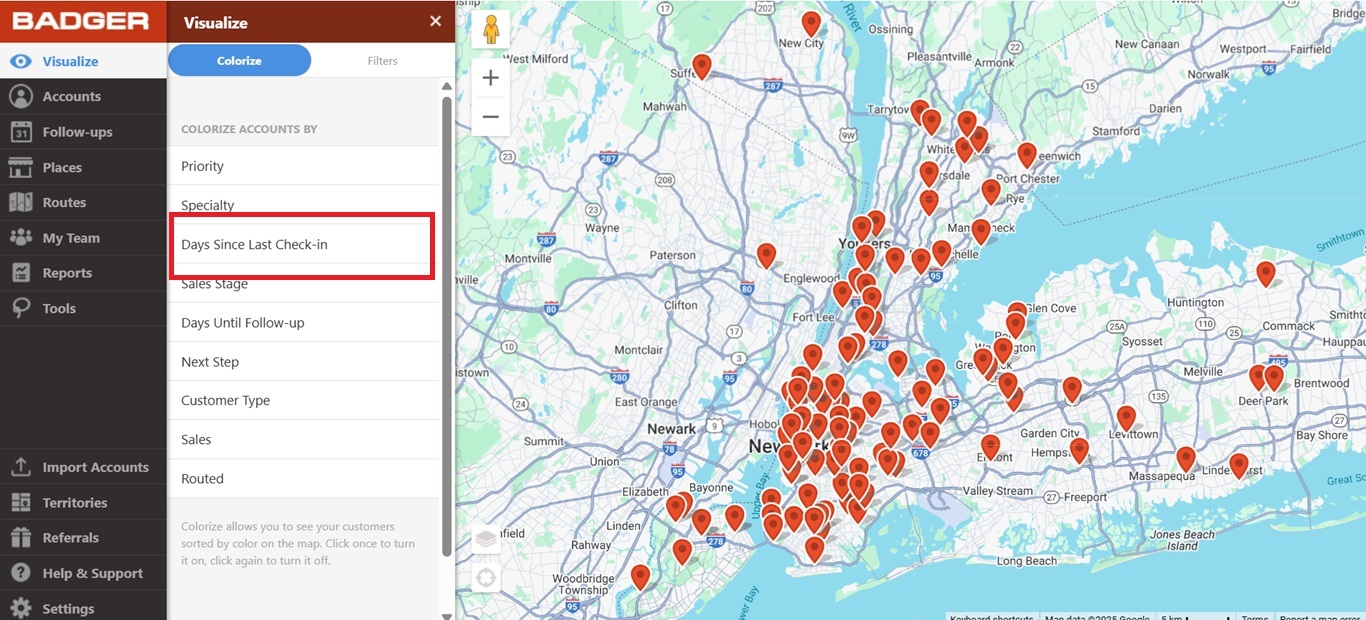
3. Since this field is automatically set as numeric filter, you’ll see that the account pins will be colored based on a gradient scale from yellow to dark red. Lighter colored pins indicate a more recent visit than the darker ones, while the gray pins are the accounts you haven't visited yet.
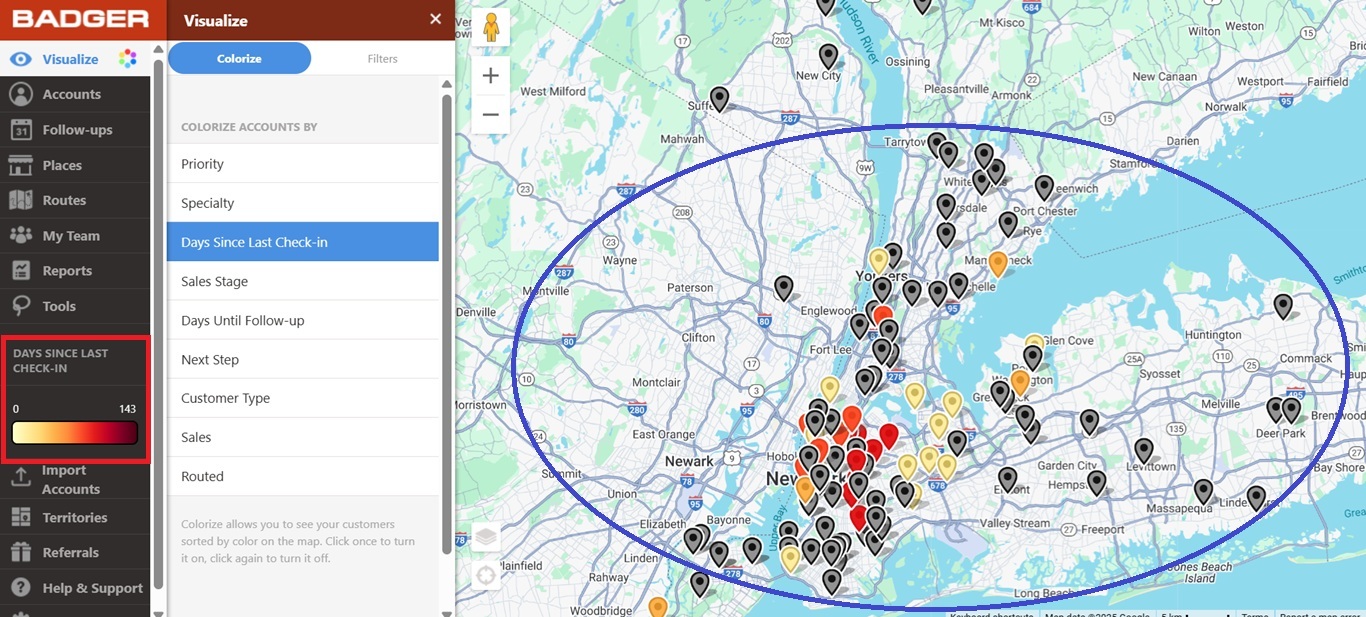
Using the same example, let’s say you wanted to see the accounts that you’ve visited in the last 60 to 225 days on the map. Here’s what you’ll need to do:
1. On the Badger Maps web app, go to Visualize and click Filters.
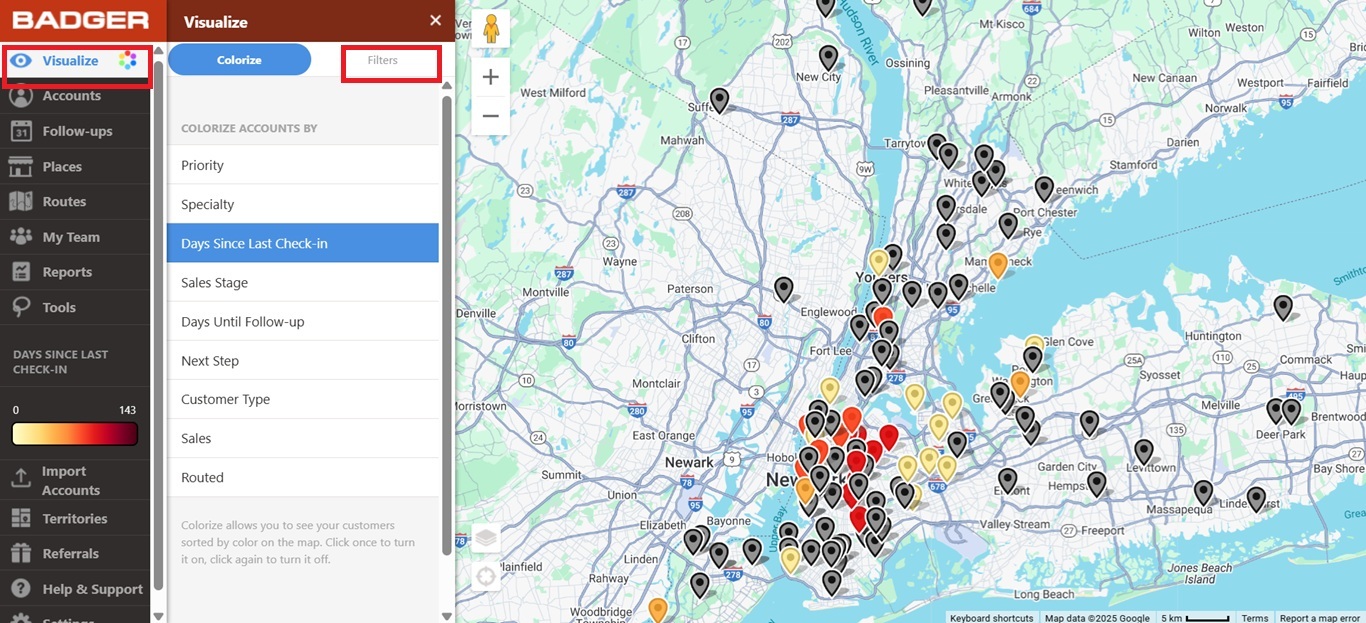
2. Scroll down, and look for Days Since Last Check-In Filter.
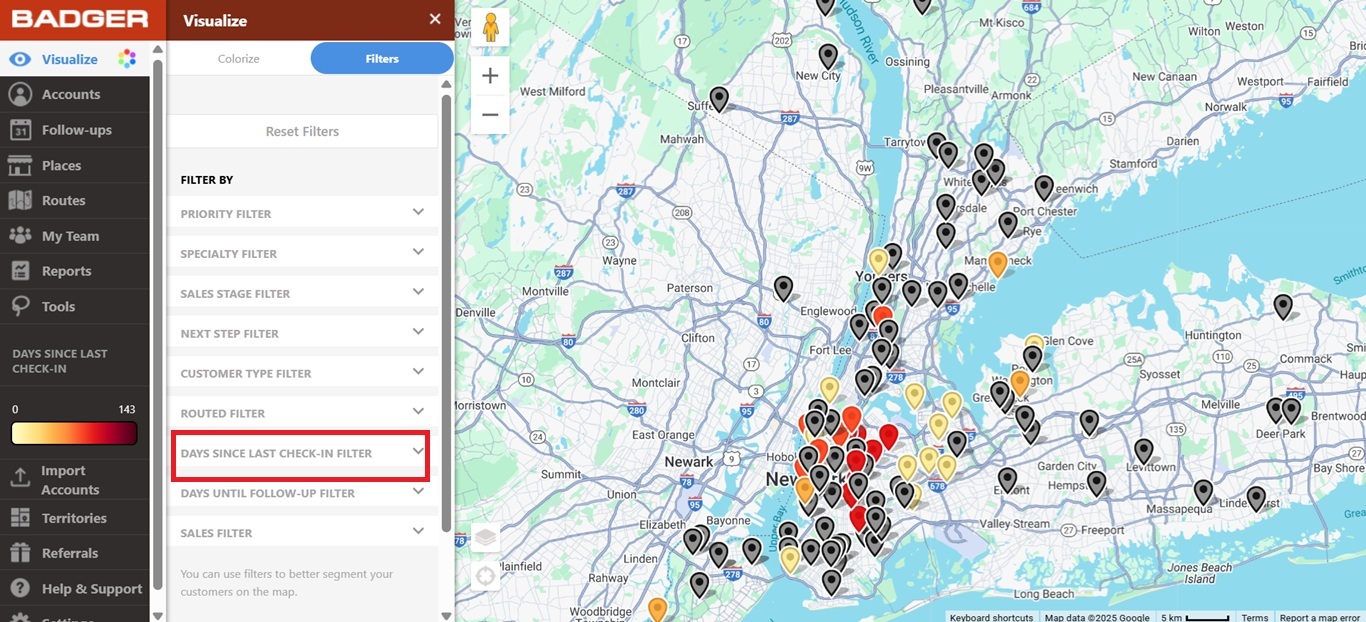
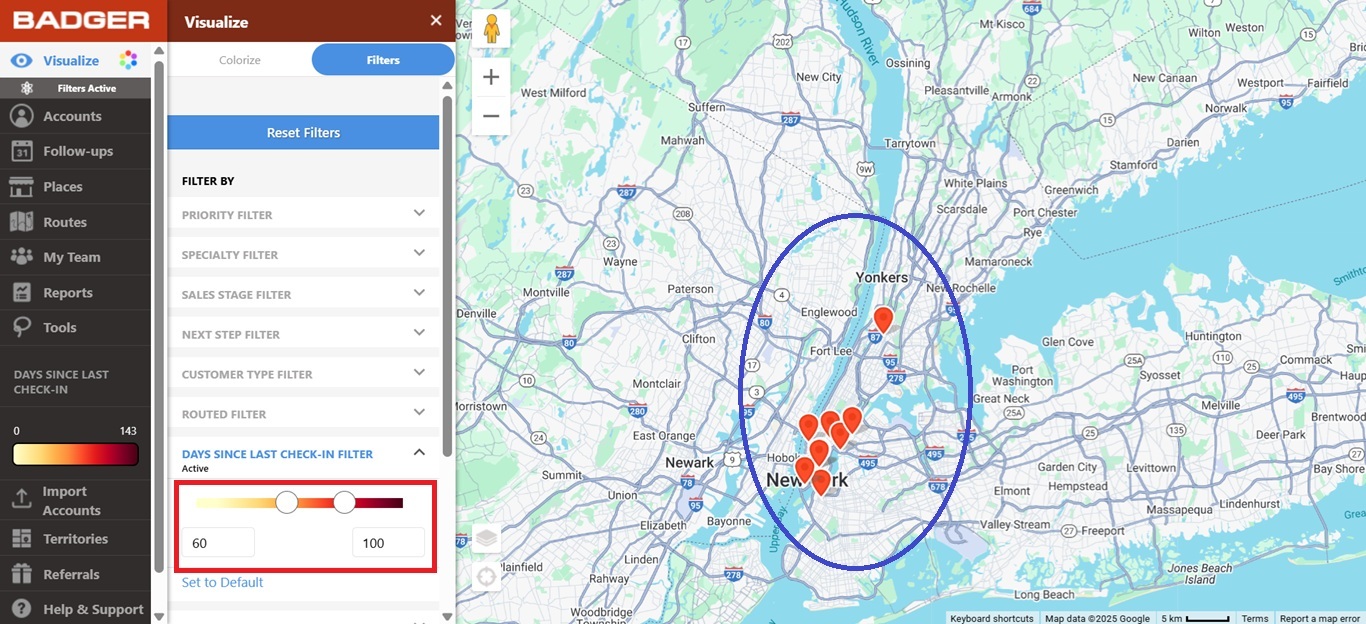
3. The next step is to use the sliders to choose the values, or type 60 and 225 on the boxes. You’ll see that the map will show the clients you’ve visited in the last 60 to 100 days.
Note: No results will be shown if the values for both boxes were set to 0.
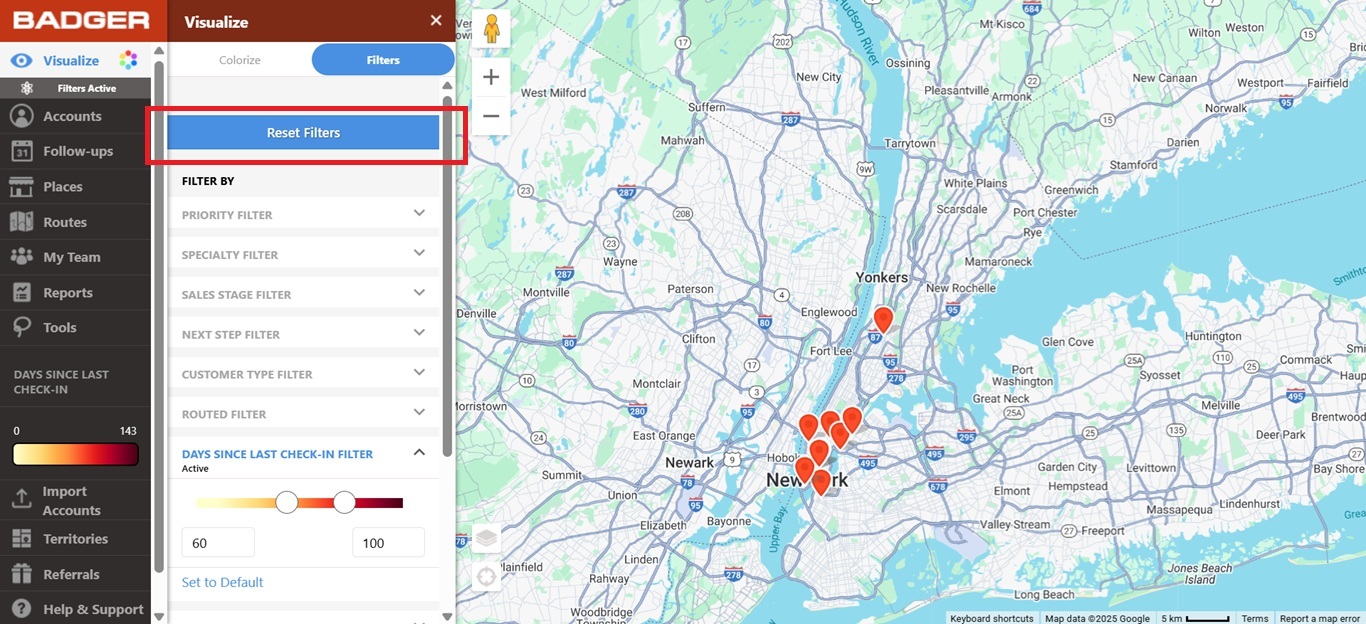
4. Scroll up to the top and click Reset Filters to bring back the rest of your accounts on the map.
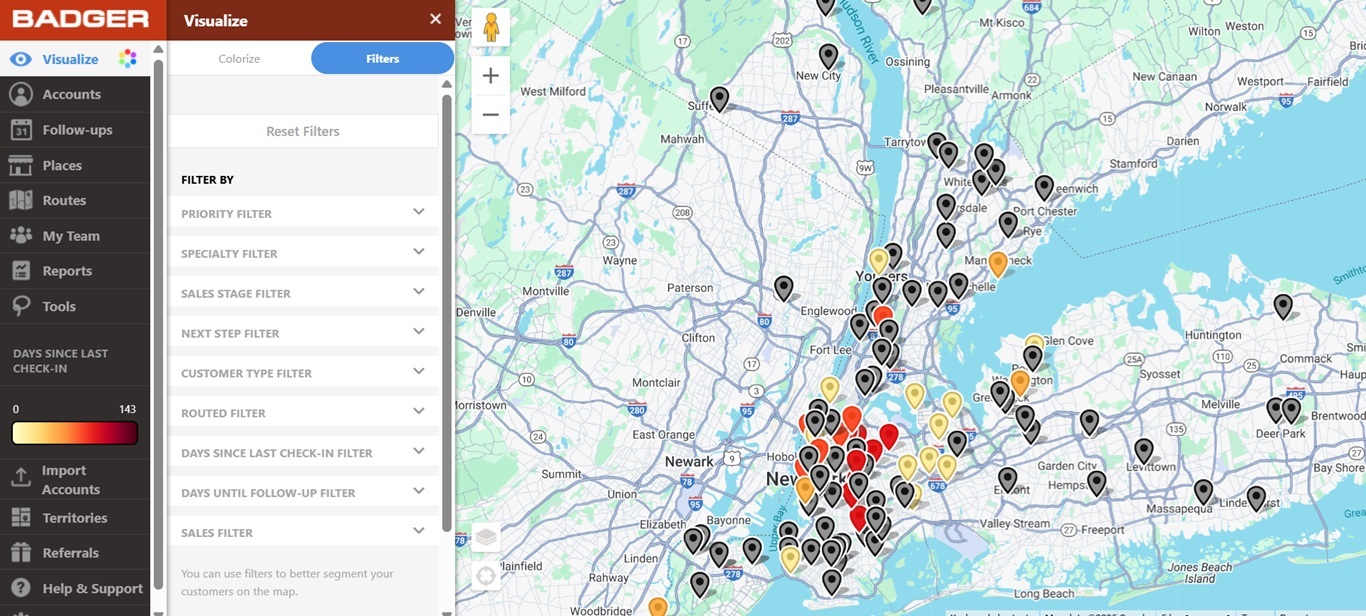
Quite easy, isn't it? Go ahead and try it now.
Looking for our logo?
Grab a Zip packed with our logo in PNG and EPS formats.
Get Started now with a free trial of Badger Maps, no credit card required!
free trial